Case study · ML systems · Team project
Gweizy — gas-price forecasting for the Base network
A live pipeline from chain to browser: collect gas prices every five minutes, forecast three horizons, serve them over an API with push updates, and turn the forecast into a "submit now or wait" decision. The system works; the forecasting edge is small, and the write-up says exactly how small.
- Result
- Winner, QMUL AI Society × Coinbase hackathon (Base Network AI Challenge), December 2025 — a four-day build, then continued development through 2026
- My part
- Backend and data collection, feature engineering, model training and validation, API, WebSocket events, caching, deployment
- Teammate
- Senan — React / TypeScript front end
- Stack
- Python, Flask, scikit-learn, PostgreSQL, Socket.IO, gunicorn, Railway · React, TypeScript, Vite, Recharts, Cloudflare Pages · Base RPC (chain 8453)
- Code
- github.com/M-Rodani1/Gweizy · front end at basegasfeesml.pages.dev (the hosted backend is not currently running, so the app shows its offline state)
One-hour directional accuracy of 59.8% against a 50% coin-flip; four- and 24-hour forecasts no better than chance; a later retraining run that failed the pipeline's own baseline check.Everything on this page comes from files committed to the repository: model_stats.json, trained_models/manifest.json, training_metadata.json and the developer log.
Problem
Base is an Ethereum L2 where gas is cheap but volatile: long quiet stretches punctuated by spikes an order of magnitude above the typical level. A user who can wait an hour would like to know whether waiting is likely to be cheaper. That is a short-horizon forecasting problem with three complications: no public historical dataset existed for Base gas at the time, the series is heavy-tailed, and the useful output is a decision ("wait" or "submit"), not a price.
Architecture
- Base RPC
eth_getBlockByNumberfor the base fee; rotation across three public endpoints after the primary started returning 429s at roughly 100 requests - Collector serviceBackground worker sampling every five minutes; base fee, priority fee (mean of recent transactions) and total gas written to PostgreSQL
- Feature pipelineCyclical hour/day encodings, lags, rolling means and standard deviations, momentum, interaction terms; later pruned to 46 features from a larger candidate set
- ModelsPer-horizon regressors for 1 h / 4 h / 24 h, spike classifiers per horizon, model registry with versioning and rollback
- Flask APIREST endpoints (
/api/current,/api/predictions,/api/explain/{horizon},/api/historical…), Socket.IO events (gas_update,prediction_update,alert), TTL cache (in-memory, Redis when configured) - Front endReact / TypeScript on Cloudflare Pages: current gas, forecasts per horizon, savings calculator, alerts; service-worker caching of static assets and API responses
Data collection
Day one of the hackathon was spent on data rather than models, because there was none. I wrote a collector that reads the latest block, derives base and priority fees in gwei and stores a row every five minutes. Two hours in, the primary public RPC began rate-limiting the collector, so the client was rewritten to rotate endpoints and back off on 429s, with aggressive caching of anything that did not need to be re-fetched. By the end of the first day the table held about 2,000 rows; by mid-December, 26,128; the February 2026 retraining window covered 20,246 samples.
Those numbers matter for everything below. A few weeks of five-minute samples is a small dataset for a series whose interesting behaviour is rare spikes, and the retraining metadata records a detected distribution shift (magnitude 2.36) between the training and holdout periods.
Features and models
The first model — a random forest on three features (hour, day of week, six-hour moving average) — was useless, with directional accuracy around a coin flip. The fix was feature engineering rather than model choice: cyclical encoding so 23:00 and 01:00 are neighbours, lagged values, rolling statistics, momentum and a handful of interactions, giving 23 features from a single raw series. On a held-out test split the candidates compared as follows.
| Model | MAE | RMSE | R² |
|---|---|---|---|
| Random forest | 0.000275 | 0.000442 | 0.071 |
| Gradient boosting | 0.000301 | 0.000465 | 0.062 |
| Ridge regression | 0.000412 | 0.000598 | 0.023 |
R² stayed at about 0.07 after all of that, which is the honest signal level for this problem at this granularity. Rather than present a low R² as failure or hide it, the product was re-framed around the quantity users need — direction — and validation switched from random k-fold to TimeSeriesSplit so that no model was ever scored on data earlier than its training window.
Recorded results
| Horizon | Model | R² | Directional accuracy | Reading |
|---|---|---|---|---|
| 1 h | Random forest + gradient boosting ensemble | 0.071 | 59.8% | Modest, real signal |
| 4 h | Ridge | 0.020 | 51.9% | Indistinguishable from chance |
| 24 h | Gradient boosting | −0.311 | 49.4% | Worse than predicting the mean |
Only the one-hour model earned its place. The four- and 24-hour forecasts were shipped in the interface but, on this evidence, should be read as "the pattern of the last day" rather than a prediction — a point I would now make explicit in the UI.
Retraining and the baseline check
After the hackathon I rebuilt training as a pipeline with the checks a live model needs: holdout-based model selection with an embargo gap of 24 samples between train and holdout, a log-transformed target, a rolling two-day training window with recency and night-time sample weighting, feature pruning to 46 features (the model manifest lists a 221-feature candidate set), per-horizon spike classifiers, and conformal prediction intervals calibrated on the holdout to 80% coverage, separately by time of day and by regime (normal / elevated / spike).
The run's metadata records persistence and mean baselines on both the training and holdout windows, and a success criterion of beating the holdout baseline by at least 5%. The February 2026 run did not meet it, and the metadata says so: passed_baseline: false, MAE 49% worse than the holdout mean at one hour. (The training script that wrote these artefacts is not part of the public repository; the metadata, manifest and diagnostics figure are.)
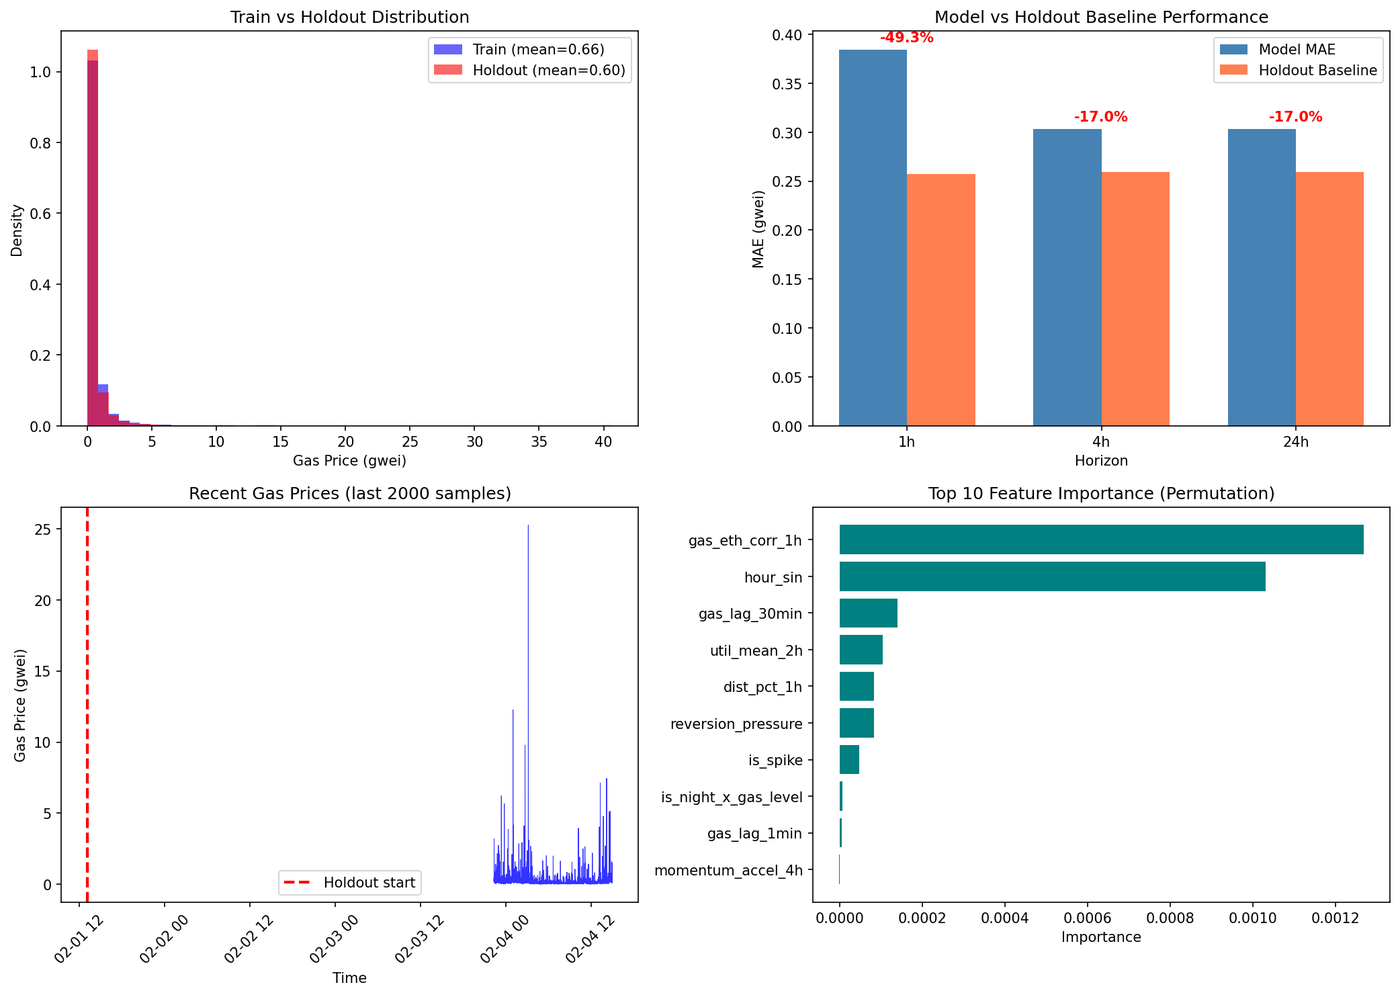
training_metadata.json records passed_baseline: false. Click to enlarge.Two things were happening. The holdout window contained a run of spikes the training window did not, so a model fitted on a quiet fortnight was scored on a violent week; and at this sample size the mean of a spiky series is a strong predictor in MAE terms. The check did its job — it recorded that the candidate had not earned promotion — and the calibrated intervals still held their 80% target on the holdout (80.0% overall; 87% at night, where the interval multiplier was widened to 1.5×). The spike classifiers were weak too: F1 of 0.26, 0.21 and 0.36 for 1 h, 4 h and 24 h on the test period. I consider this the most useful output of the project: a pipeline that tells you when your model has not earned deployment.
Serving and deployment
- API. Flask blueprints for gas, predictions, explanations, historical data, analytics, alerts and model versioning; documented in
docs/API.md. Responses cached in a 300-second TTL cache, Redis-backed when aREDIS_URLis present. - Push updates. Socket.IO replaces polling: the collector emits
gas_update, model refreshes emitprediction_update, and threshold alerts emitalert. - Operations. gunicorn on Railway with a health endpoint, a circuit breaker around RPC calls, safe model loading with fallback, an accuracy tracker for live predictions, and an auto-rollback service that reverts to a previous model version when measured accuracy degrades past a threshold.
- Quality. pytest suites for the collector, feature engineering, hybrid predictor, versioning and routes; GitHub Actions runs backend tests and lint, frontend tests, a dependency audit, the production build and a bundle-size check.
About the "40% savings" claim
The repository README and the app's landing page say "save up to 40%". I have not repeated that on this site. The savings calculator computes cost(current gas) − cost(lowest predicted gas across horizons) for a chosen transaction type: it is the difference between now and a forecast, not an observed outcome. No backtest of "wait" decisions against realised prices exists in the repository, and the walk-forward evaluations of a later reinforcement-learning timing agent (three folds each) did not show positive mean savings. The honest statement is that the interface estimates how delaying a transaction could reduce gas cost under predicted network conditions.
Limitations
- Weeks of data, not months; a distribution shift between training and holdout was detected (magnitude 2.36 in the run's own check) and not resolved.
- Forecast skill is confined to the one-hour horizon and is modest there. Longer horizons are not useful predictions.
- The February 2026 retraining did not beat the mean baseline; the recorded per-horizon metrics above are from the December build.
- The hosted backend is not currently running; the front end still deploys, but shows offline states.
- The four-day hackathon build and the later system are different in maturity; the award was for the former.
What I would do next
- Evaluate the decision, not the price: a cost-based backtest of "wait N minutes" against realised gas, reported as a distribution of savings including the losses.
- Replace point forecasts with quantile forecasts and show the interval in the interface; the conformal calibration already exists.
- Collect a much longer history before retraining, and test simple seasonal baselines (same hour yesterday, same hour last week) that a small model must beat.
- Move the spike problem to an event-rate framing (probability of a spike in the next hour) where the classifiers can be judged on calibration.