Case study · Applied systems · Team project
My Heat Pump Explained
Smart heat pumps do things that look wrong — heating at 2 a.m., easing off when the grid asks — and people who cannot see why switch the automation off. This tool explains the behaviour. The design decision that matters: the diagnosis is deterministic, and the language model only writes the sentence.
- Context
- Diverse AI Hackathon 2025, "Flex for All" track, November 2025. Team entry from QMUL; no placement is recorded
- My part
- The code in the repository: rule engine, benefit calculations, LLM explanation layer with fallback, Streamlit dashboard
- Stack
- Python, Streamlit, Anthropic API (Claude Sonnet 4), Plotly, pandas
- Data
- Property profiles extracted from the Electrification of Heat (EoH) dataset; scenarios are synthetic, seeded from those profiles
- Code
- github.com/M-Rodani1/My-Heat-pump-explained
Eight ordered rules decide what the heat pump is doing. Claude gets the detected condition, the measurements and the computed benefit, and returns at most fifty words. If the API fails, a template says the same thing.
Problem
A heat pump on a smart tariff or a grid-flexibility contract makes decisions on the householder's behalf: pre-heating before a cold snap, shifting demand into cheap-rate hours, curtailing output when the grid operator signals. Seen from the living room, each of these looks like a malfunction. The hackathon brief was to make automated behaviour understandable enough that people keep it switched on. The requirement I set myself was that an explanation must never be invented: whatever the app says is happening has to come from a check on the numbers, not from a model's guess.
Architecture
- Measurementsindoor and target temperature, outdoor temperature, COP, power draw, tariff price, grid (VPP) signal, weather forecast, timestamp
- Rule engineordered threshold checks return one pattern with severity, confidence, trigger text and category
- Benefit calculationfor tariff-shift and curtailment patterns: money saved today and CO₂ avoided, from the scenario's price and consumption
- ExplanationClaude Sonnet 4 writes ≤50 plain-language words from the pattern, measurements and benefit; templated fallback on any error
- Guidancethree tiers — normal / check / urgent — with an action, chosen from the pattern, not the text
- DashboardStreamlit: scenario explorer, "what we detected", explanation, action, and a transparency panel showing the raw data and the rule that fired
The rule engine
detect_pattern() checks conditions in a fixed order and returns on the first match, so anomalies take priority over benign explanations. Thresholds are as written in the code.
| # | Condition | Pattern | Severity | Category |
|---|---|---|---|---|
| 1 | COP < 1.8 with outdoor temperature above 0 °C | Efficiency anomaly | High | Potential fault |
| 2 | Indoor more than 2 °C below target while status is "heating" | Temperature deficit | Medium | Performance issue |
| 3 | Power draw above 1.5 × a 3 kW residential reference | High power consumption | Medium | Efficiency concern |
| 4 | Hour 00–05 and electricity price below £0.12 / kWh | Tariff optimisation | None | Smart behaviour |
| 5 | Grid (VPP) signal active and indoor below target | Grid curtailment | None | Smart behaviour |
| 6 | Forecast temperature more than 5 °C below current outdoor | Predictive pre-heating | None | Smart behaviour |
| 7 | Outdoor below 0 °C with COP between 2.0 and 2.8 | Cold-weather operation | None | Normal operation |
| 8 | Nothing above matched | Normal operation | None | Normal operation |
Each pattern also carries a human-readable trigger (for example "COP of 1.6 is unusually low for 4 °C") that the dashboard shows verbatim in its transparency panel. That string, not the generated prose, is the audit trail.
The explanation layer
The model call is deliberately narrow. The prompt contains the detected pattern, the measurements and the computed benefits, and asks for an explanation in under fifty words with no jargon. The call uses claude-sonnet-4-20250514 with max_tokens=120; the response is word-counted and truncated if it exceeds fifty words. The whole call sits in a try block: any exception — no API key, network failure, rate limit — falls through to _fallback_explanation(), a per-pattern template filled with the same numbers, so the dashboard degrades to slightly stiffer sentences rather than to an error.
Keeping diagnosis out of the model is what makes the system defensible. Two users with the same measurements get the same detected condition and the same recommended action; only the wording varies. It also makes the hard part testable: the rule engine is plain Python with no external dependency.
Data
property_profiles.py reads the EoH summary table, keeps installations included in the seasonal-performance analysis, and extracts a handful of representative properties across SPF bands (above 3.0, 2.5–3.0, below 2.5) with their heat-pump type, size and building age. The scenarios the dashboard replays are synthetic: generated from those profiles with plausible values (for example a night-time COP of the property's SPF minus 0.2), then saved to scenarios_from_real_data.json. Real property characteristics, invented moments in time. The app does not ingest live telemetry.
Dashboard
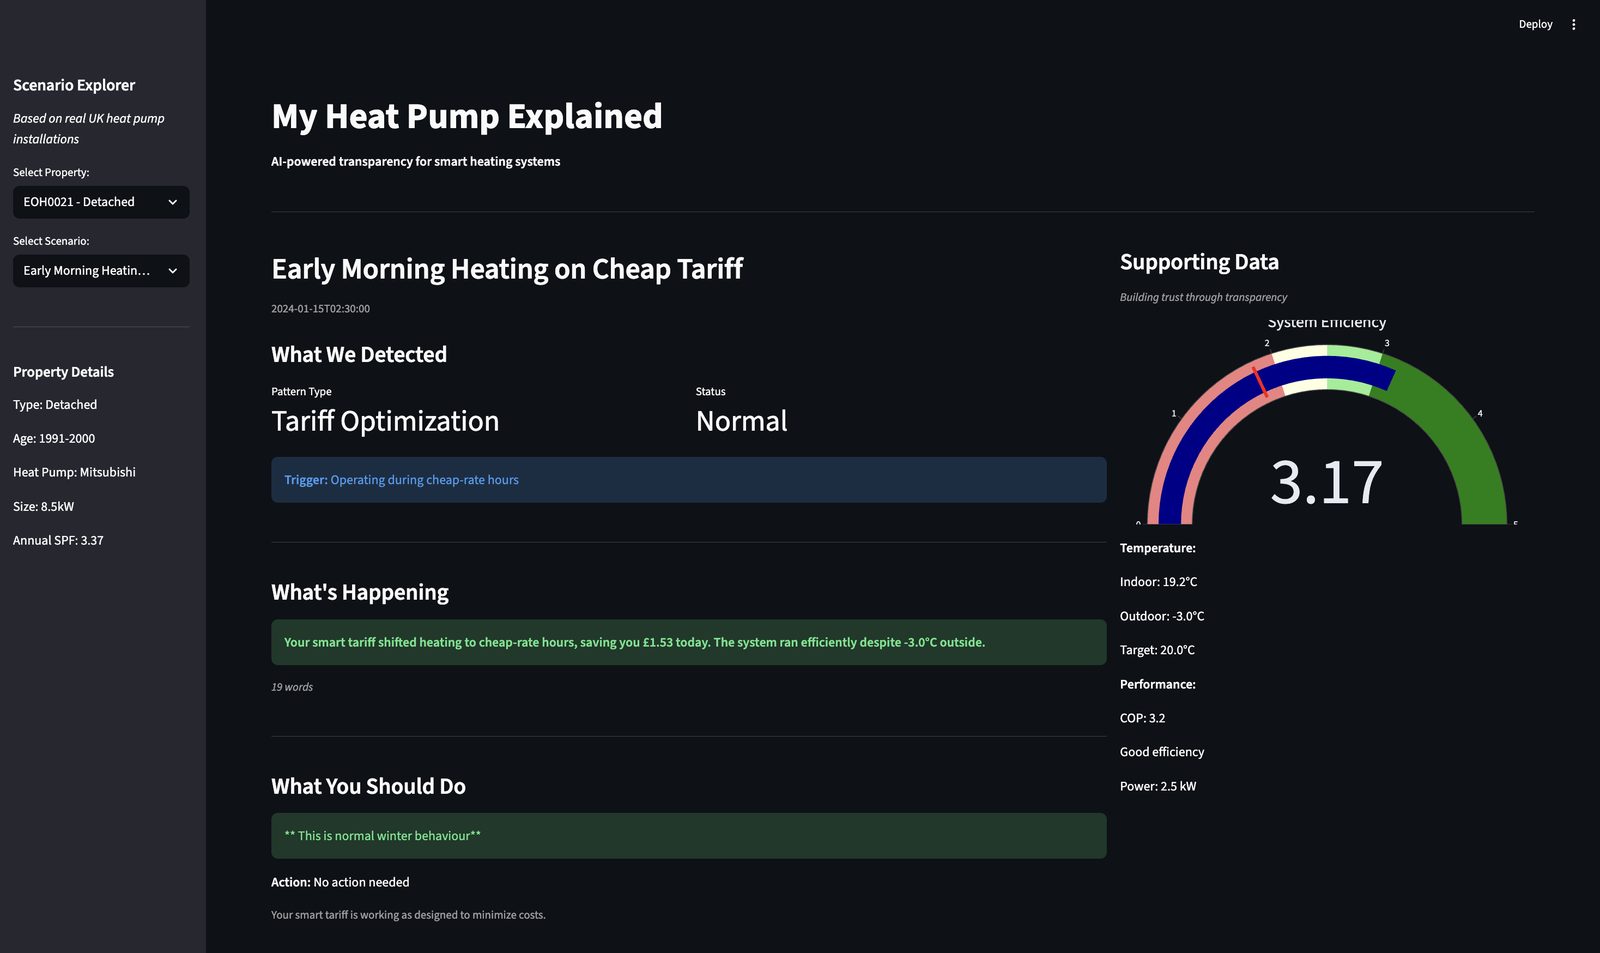
A screen recording of the dashboard in use is also in the repository assets: demo_heat_pump_video.mp4 (MP4, about 5 MB).
Limitations
The thresholds are hand-set from domain reading, not learned from labelled faults, and have not been validated against real fault records. "COP below 1.8 above freezing" is a reasonable heuristic, not a calibrated detector.
The scenarios are synthetic. The EoH dataset grounds the property profiles; it does not supply the minute-by-minute measurements the rules evaluate.
The generated explanations were checked for length and tone by hand during the hackathon. There is no systematic faithfulness evaluation — no test that the prose never contradicts the rule that fired.
The repository README quotes adoption, household-savings and CO₂ figures from the pitch. They are not sourced in the repository, so they are not repeated here. The evidence for this project is the implementation.
No user testing was done.
What I would do next
- Fit the anomaly thresholds from EoH telemetry (COP conditional on outdoor temperature and flow temperature) and report false-positive rates per property type.
- Log the rule trace next to every generated explanation and add an automatic contradiction check before the text is shown.
- Replace the fixed 3 kW power reference with a per-property expectation derived from unit size and outdoor temperature.
- Run a small user study on whether the explanations change the decision to override.